2017 Risk Adjustment Transfer Payment Results: Same Game, Different Outcomes
Year-over-year gross transfer dollars increased 2% nationally across the Individual and Small Group risk pools but range from -99% to 1000+% across state markets.
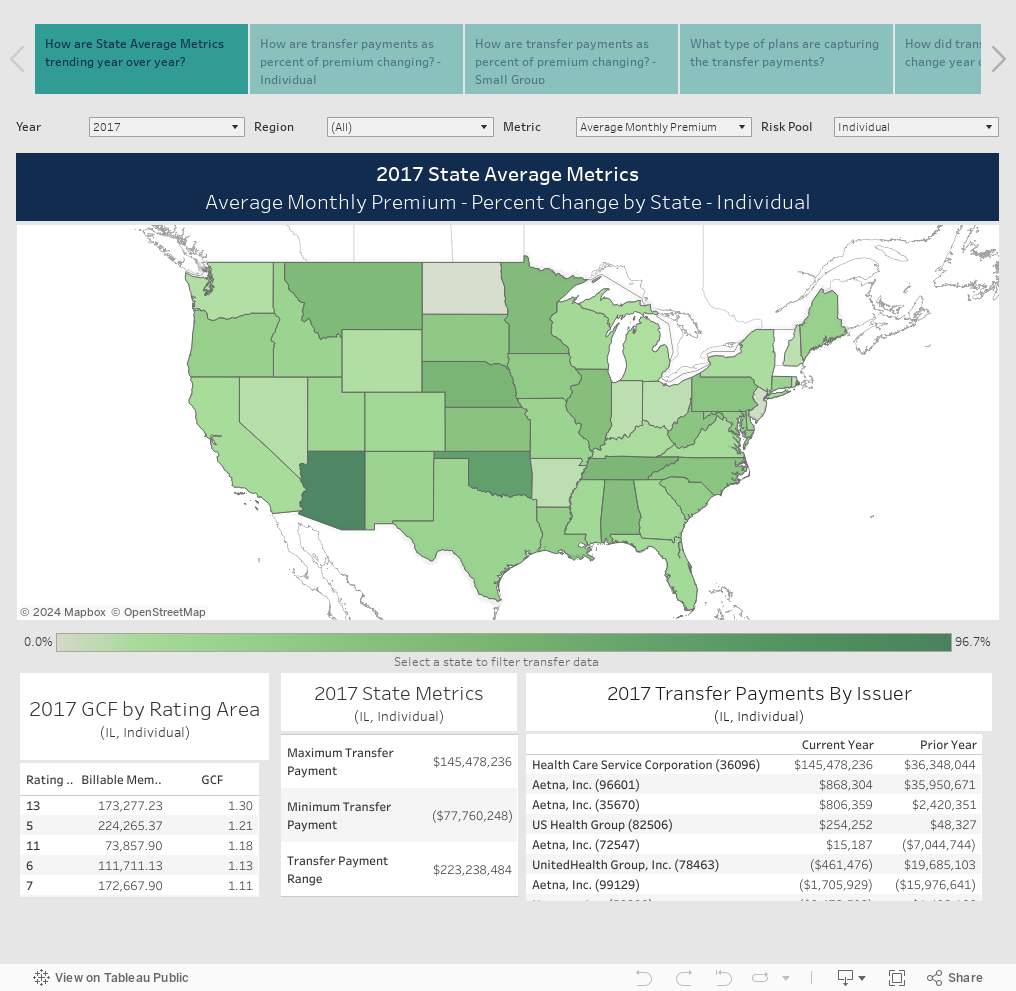
On July 9th, 2018, the Centers for Medicare and Medicaid Services (CMS) released the Affordable Care Act (ACA) Risk Adjustment Transfer Payment results for the 2017 benefit year. Litigation in New Mexico initially caused uncertainty around the finality of the transfer payments; however, CMS will proceed with the collection and distribution of these payments as confirmed by a final ruling on July 24th, 2018. While premiums rose across the country in 2017, we continue to see widespread variation from state to state in the Individual and Small Group risk pools. Premiums in the Individual market increased for both Utah and North Carolina (18% and 36%, respectively); however, Utah’s state average premium of $336 is less than half of North Carolina’s state average premium of $675.
For the first time, the ACA Individual market experienced a decline in billable member months. Minnesota, Louisiana and Arizona saw the largest percentage decreases, and also have some of the highest statewide average premiums at $560, $561 and $623, respectively. Although, not every state experienced a decline. New Jersey, New Hampshire and Arkansas experienced slight increases to Individual membership and had lower statewide average premiums of $492, $412 and $390, respectively. The correlation of statewide average premiums to membership is likely the result of non-subsidized members exiting the market as they take on 100% of the premium increases. States with higher unsubsidized Individual populations are potentially more impacted by this trend. The dashboard below highlights the state-based results of payment metrics year-over-year.
Note: A discount has been applied to all “Prior Year Average PLRS” to account for yearly changes to the CMS-HHS risk adjustment model, allowing for year-over-year comparison.
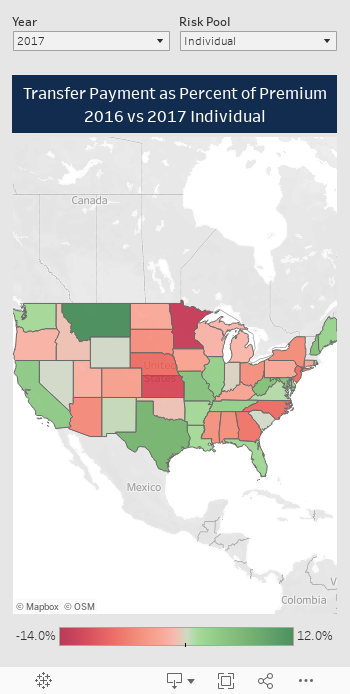
Transfer Payments as a Percent of Overall Premiums
The significant variability in the ACA market is also present between the Small Group and Individual risk pools in terms of transfer payment as percent of premium. In the Individual market, transfer payments as a percent of premiums ranged from less than 1% to over 25%, and many states experienced a substantial change from last year. Minnesota’s transfer payment as a percent of overall premium was 21.5% in 2016 and fell to 8.9% in 2017. Montana, on the other hand, experienced a jump of 11.8% in 2017, increasing from 3% to 14.9%. The rise in premiums for most states amplified the gross dollars being transferred but reduced the transfer payments as a percent of premium. States that had an increase in premiums and an increase in transfer payments as a percent of premium, like Montana which saw a 46% average premium increase, experienced significant year-over-year market volatility.
The Small Group market is more consistent, with transfer payments as a percent of premium generally in line with prior years.

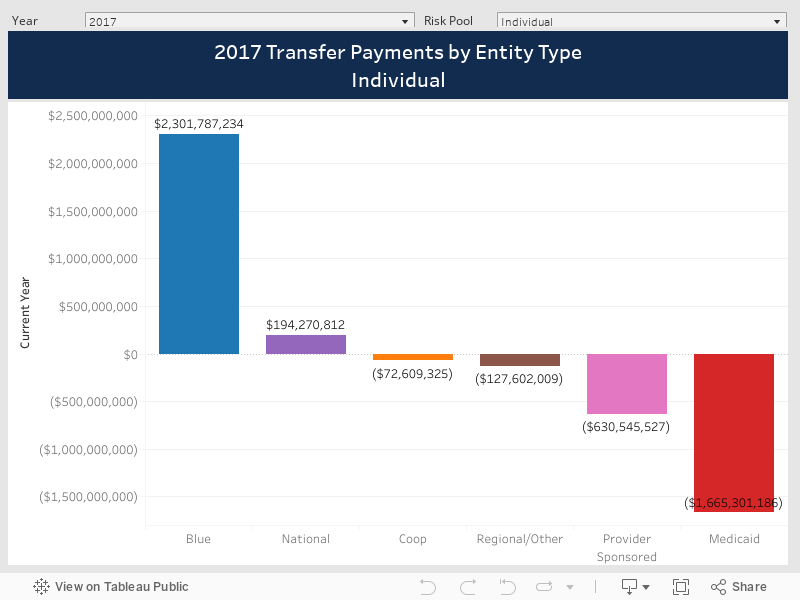
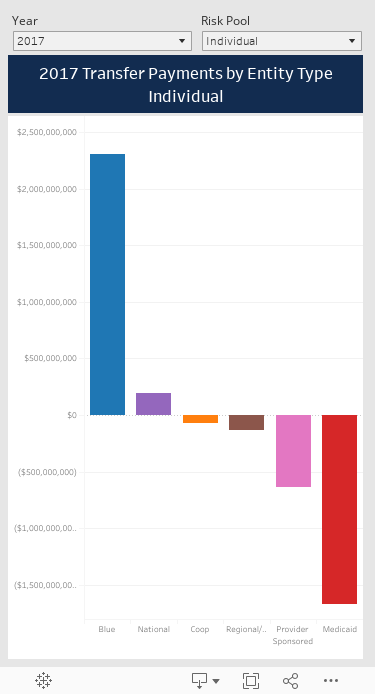
Who is Capturing the Transfer Payments?
Understanding that transfer payments are not a proper measurement of who is “winning” or “losing” in the market, there are some interesting trends that emerge when evaluating the results by issuer type (i.e., Blues Plans, National, Co-op, Regional/Other, Provider-Sponsored and Medicaid). In the Individual market, the Blues continue to be the predominant receiver, led by the larger Blue Plans (e.g., HCSC, FloridaBlue and Blue Shield of California). Provider-Sponsored Plans had an interesting four-year trend, annually increasing their net transfer payment outflow position each year through to 2017 after having been a net receiver in 2014 (driven significantly by Kaiser’s position shift in the market). Less variation exists in the Small Group market with the Nationals and Blues receiving the majority of transfer payments from Provider-Sponsored Plans.
It is important to note that not all plans have a strategy to be a net receiver in these markets, and the post-risk adjusted Profit and Loss (P&L) is the best measure of financial success in any market.
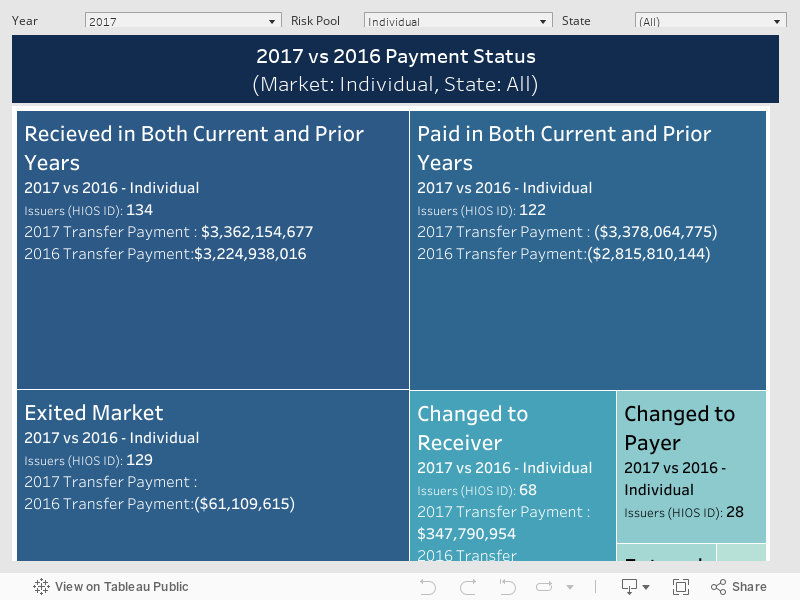
Year-Over-Year Transfer Payment Consistency
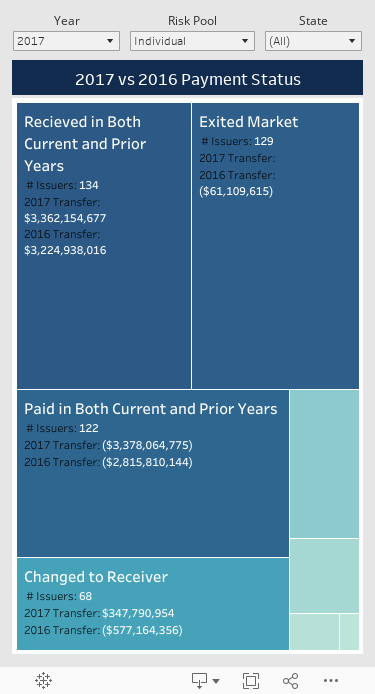
At an issuer level, the Individual market continued to see volatility. Only 51% of issuers in the Individual market stayed consistent in their transfer payment status (receiver vs. payer), down from 61% and 53% in 2015 and 2016, respectively. 134 issuers received a transfer payment in both 2016 and 2017, and 122 were net payers in both 2016 and 2017. With a record 129 issuers leaving the market in 2017, the remaining issuers experienced a shift in their membership mix as they gained new enrollees from the exiting plans. In many cases, this led to a change in relative risk for issuers.
Unlike the Individual market, Small Group remained consistent with ~70% of issuers maintaining payer or receiver status from 2016 to 2017, increasing from 61% in 2016.
What Should Issuers Do?
It is critical for issuers to fully understand the makeup of their transfer payment. What were the primary and secondary drivers and were there opportunities to change the outcome that should inform 2018 strategies? Every issuer should be able to answer the following questions:
- Were there internal data quality issues from membership and encounter receipt through to submission and acceptance that impacted risk revenue (unreported risk)?
- How much of my transfer payment was impacted by risk that has gone undocumented?
- How much of my transfer payment inflow/outflow was driven by the mix of members attracted?
Knowing the answers to these questions for 2017 will allow issuers to focus on improvement opportunities that can have a material impact on 2018 results and beyond.
The full dashboard from this analysis is below.