
2018 ACA Risk Adjustment Interim Report: Huh, Yeah, What is it Good For?
Though there are challenges to interpreting the results of CMS’ annual interim risk adjustment report, the answer to the question “what is it good for?” is certainly not “absolutely nothing.”
CMS’ annual interim risk adjustment report provides many health plans with their first insights into the risk of their state market and their relative position, outside of third-party actuarial reporting to which many plans subscribe. The usefulness of the information contained in the interim report is predicated on the completeness and accuracy of the data submitted by all issuers in the state. Due to the complexities of submitting timely and accurate data to the EDGE server, especially when measuring inputs a few months prior to the April 30th deadline, the interim reports have shown significant historical variation. Pareto conducted an analysis on the recently released 2018 interim report, as well as the past interim and final reports, to assess national and state-level trends in the ACA market.
ACA Market Trends: 2016-2018
Individual Market
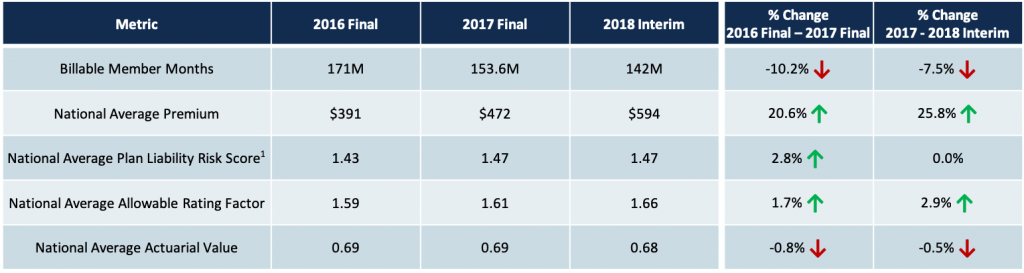
1: PLRS figures for 2016 and 2017 have been normalized to reflect coefficient changes in the 2018 model. Based on an internal analysis of Individual market PLRS impact due to model updates, the 2016 PLRS has been reduced by 11.9% and the 2017 PLRS has been reduced by 5.0%.
Nationally, the Individual market experienced a 52% premium increase in a two-year span from 2016 to 2018 with relatively moderate increases in risk score (PLRS). Year-over-year increases to allowable rating factor, which correlates to the age of the population, and PLRS paired with a declining membership are indicators of younger, healthier members leaving ACA plans likely due to higher premium rates.
In most states, premiums have now caught up to, and in some cases surpassed, the risk being managed with many issuers achieving sizable profit margins in the Individual market. As a result, premiums in the Individual market have largely plateaued or reduced in 2019. While 2019 premiums are not incorporated into this analysis, recent news, coupled with Pareto’s work with issuers to set 2020 product and pricing strategy, sets the expectation of continued steady or reduced premium rates in 2020.
Small Group Market
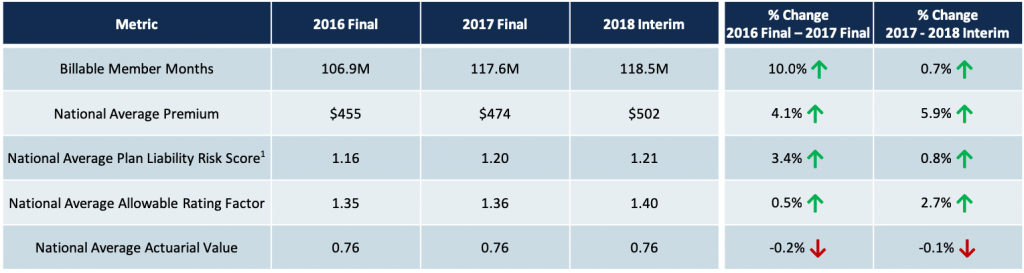
1: PLRS figures for 2016 and 2017 have been normalized to reflect coefficient changes in the 2018 model. Based on an internal analysis of Small Group market PLRS impact due to model updates, the 2016 PLRS has been reduced by 14.0% and the 2017 PLRS has been reduced by 6.1%.
The Small Group market has experienced marginal premium increases, and when paired with the expiration of grand-mothered plans, has led to slight market growth from 2016 to 2018. On a normalized basis, the risk in the market has increased, likely due to the trend of issuers converting healthier groups to less expensive, non-ACA compliant plans. Increased allowable rating factors support the trend of younger, healthier groups leaving the ACA market. The transitioning of healthier groups to non-ACA plans is expected to continue in 2019 and beyond, projecting persistent market trends of increased risk, slight premium increases, and flat-to-declining market size.
Individual Market PLRS Trends
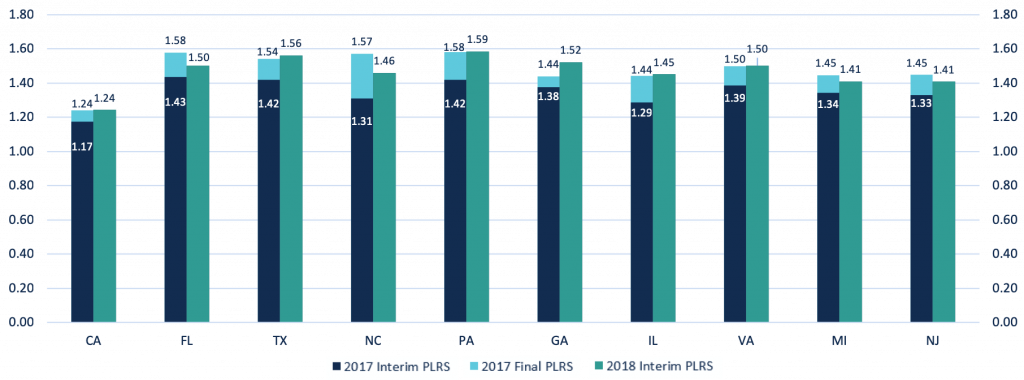
1: PLRS figures for 2016 and 2017 have been normalized to reflect coefficient changes in the 2018 model. Based on an internal analysis of Individual market PLRS impact due to model updates, the 2016 PLRS has been reduced by 11.9% and the 2017 PLRS has been reduced by 5.0%.
On a normalized basis, risk is increasing in the Individual market, with a majority of the top 10 states by market size showing higher interim 2018 risk scores when compared to final 2017 PLRS values. On a state-by-state basis, significant variation in PLRS increases was seen from interim to final 2017 reporting. This highlights that even as market experience with EDGE submission matures, the reliability of interim report PLRS figures is not necessarily improving as a measure of projecting final market PLRS figures.
Individual Market Premium & Membership Trends
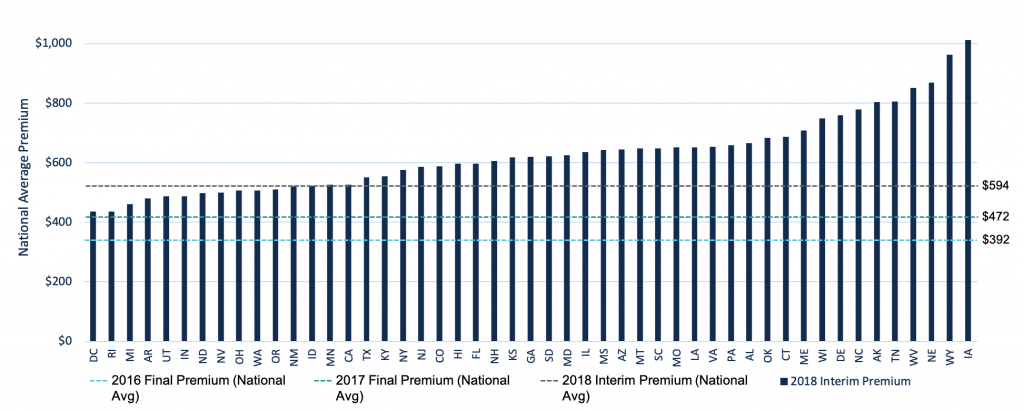
Premiums in the Individual market have increased over $200 PMPM from 2016 to 2018, with continued rate hikes focused on ensuring profitability in the wake of higher than expected market risk and macro-market challenges such as the elimination of CSR payments. When comparing the 2018 interim premium rates to historical national averages, all states have higher premiums than the 2016 national average and only four states have lower premiums than the 2017 national average. With 2018 premiums better positioned to cover the underlying risk of the market, the trend of flat-to-reduced premium rates in 2019 is expected to continue into 2020.
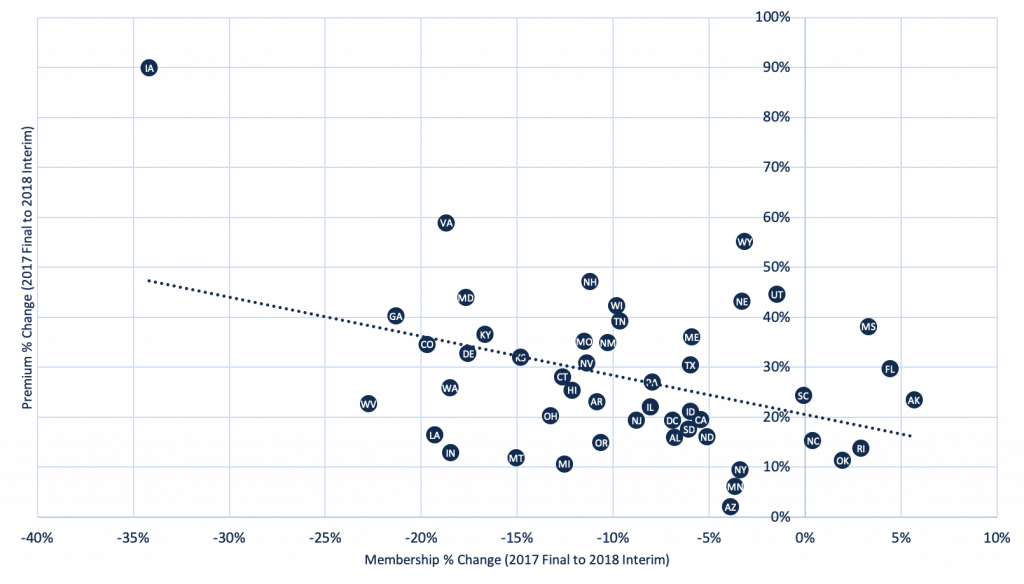
There is significant variability by state in how 2018 premium increases impacted 2018 membership trends. Premiums increased by nearly 60% in Virginia, compared to 13% in Indiana, yet both states experienced an 18% reduction in enrollment. Few states experienced market growth with rate increases in excess of 20%. Measuring historical enrollment elasticity to premium rate changes in the states in which plans operate is difficult with the large proportion of the population receiving subsidies, but still can be a valuable data point for stress-testing the impact of future rate setting strategy on projected membership.
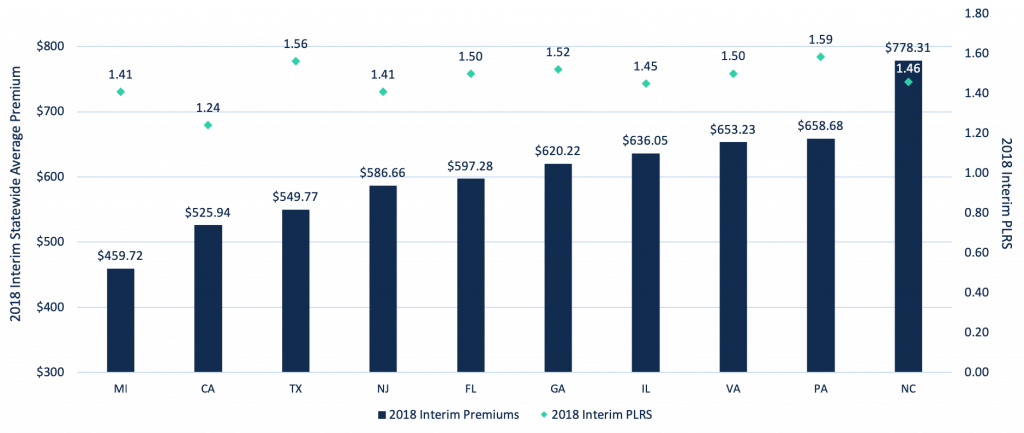
Individual Market Premium & PLRS Trends
Next Steps
As noted previously, significant variation between the interim and final risk adjustment reports in previous years may make it difficult to make any decisions based on 2018’s interim report. However, regardless of the outcome, there are a few key activities that issuers can focus on based on this report:
- As the 4/30 deadline approaches, leverage historical experience from the interim and final reports to validate and stress-test accruals and estimate impending transfer payments for 2018. The AV, ARF and billable member month figures provided in the interim reports, in particular, can be helpful gauges for this year’s market, as these variables experience little-to-no variation from interim to final reporting.
- Ensure that every record is completely, accurately and compliantly submitted to the EDGE server in preparation for the 4/30 deadline. From Pareto’s client experience, even a 1% reduction in risk score due to data quality issues can correspond to a $3M to $4M transfer payment impact.
- Leverage the trends seen in the interim report as it relates to PLRS, ARF, and AV to influence and inform 2020 product strategies. Coupling this information with as much initial state-level 2019 information as possible will provide the clearest picture of where the 2020 market is headed. While historical performance is a strong data point for anticipating future trends, the ACA market is in constant flux. Plans need to ensure pricing and product strategy is interpreting where the market will be in the future, not where it is currently situated.
To further discuss these trends, or to learn more about Pareto’s solutions to ensure complete and accurate encounter submissions, contact us to request a demo.