2018 ACA Risk Adjustment Transfer Payment Results: “Premium Stabilization Program” Beginning to Stabilize
On June 28th, 2019, the Centers for Medicare and Medicaid Services (“CMS”) released the Affordable Care Act (“ACA”) Risk Adjustment Transfer Payment results for the 2018 benefit year. Within days of the announcement, Pareto published a preliminary analysis highlighting major trends and year-over-year comparisons into state average metrics, issuer transfer payments, and high-cost risk pool payments. Over the last few weeks, the Pareto team dove deeper into the data to uncover even more meaningful insights from the results, which we have shared below.
Macro-Level Market Themes

Issuers in the ACA experienced larger variances between minimum and maximum transfer payments in 2018 compared to 2017. In the Individual Market, variances in transfer payments were driven by rising premiums across almost all states outpacing the decline in enrollment. The Individual Market continued to see an outflow of players in many state markets, including 5 states that now only have one insurer offering coverage (AK, DE, IA, NE, WY). The Small Group Market continued to stabilize in 2018 after further decreases in premiums and increases in enrollment.
| Individual | Small Group | ||||
| 2017 | 2018 | 2017 | 2018 | ||
| Max Inflow (Receipt) | $666M | $785M | $217M | $207M | |
| Max Outflow (Payment) | ($344M) | ($501M) | ($337M) | ($312M) | |
| Range | $1,010M | $1,286M | $554M | $519M | |
Note: The above are distinct transfer payment values and are not summations by year.
Continued Reduction in Enrollment
- All but six states in the Individual Market saw a decrease in ACA Enrollment, led by Iowa and West Virginia with 35% and 23% enrollment decreases, respectively.
- Small Group is a different story, however. 31 of 49 states in the CMS report experienced growth in 2018, ranging from 1% to 29% growth.
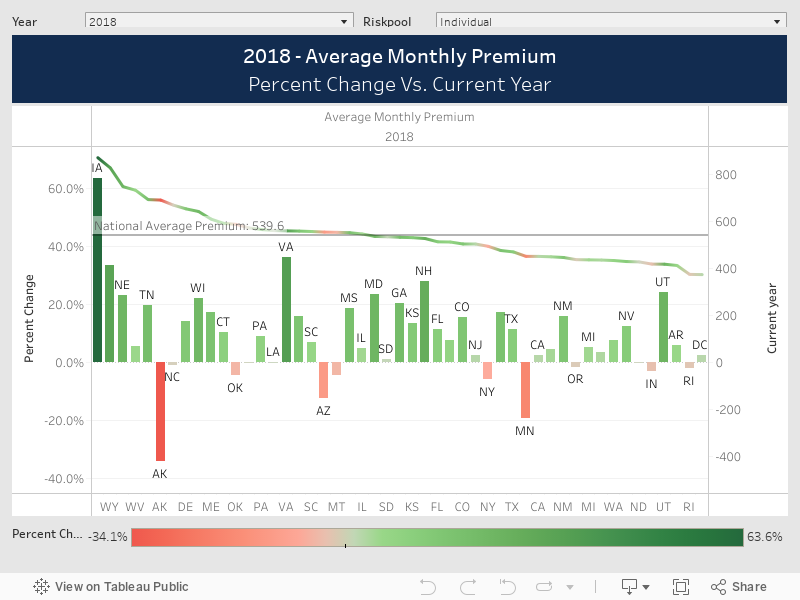
Premium Stabilization
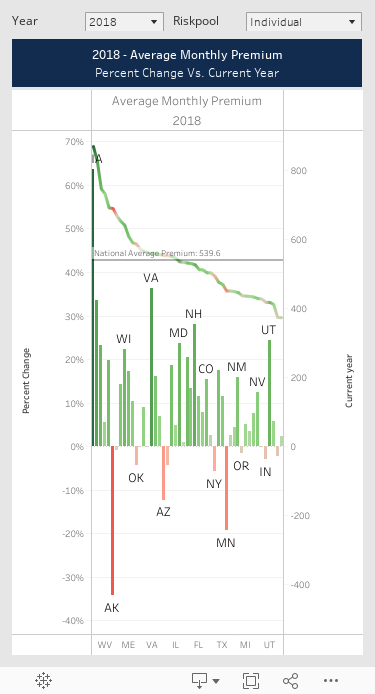
- Individual – 37 states had premium increases in 2018, led by:
- Iowa (+$338.50; 64% Increase)
- Virginia (+$148.84; 36% Increase)
- Wyoming (+207.48; 34% Increase)
- Small Group – All states experienced a premium decrease in 2018, led by:
- Alabama (-$67.67; 15% Decrease)
- Michigan (-$60.13; 14% Decrease)
- Idaho (-$50.42; 13% Decrease)
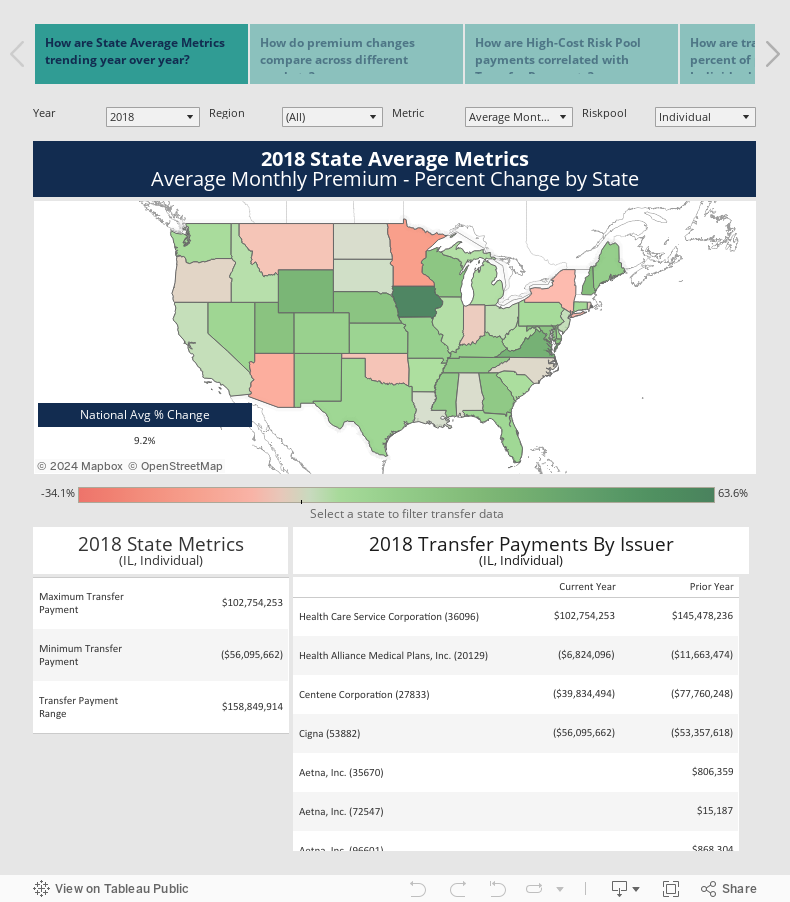
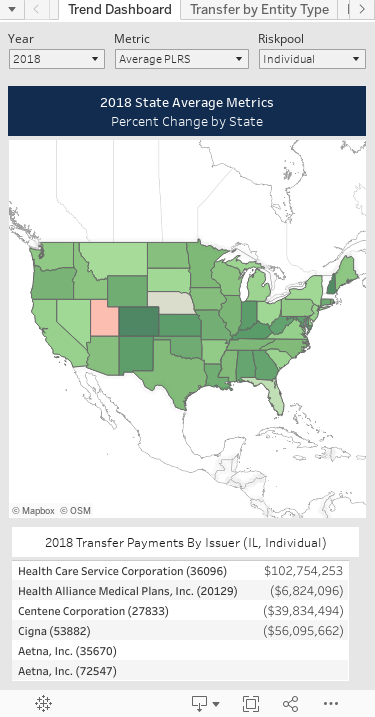
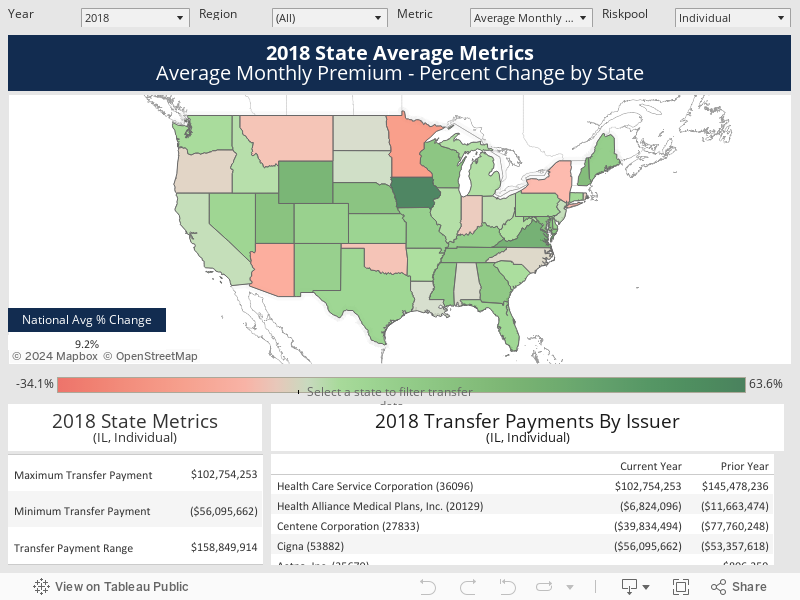
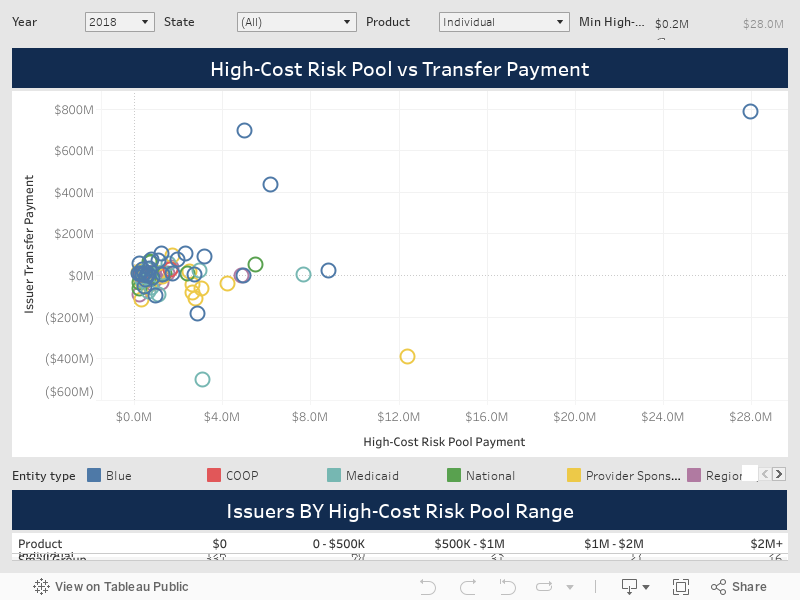
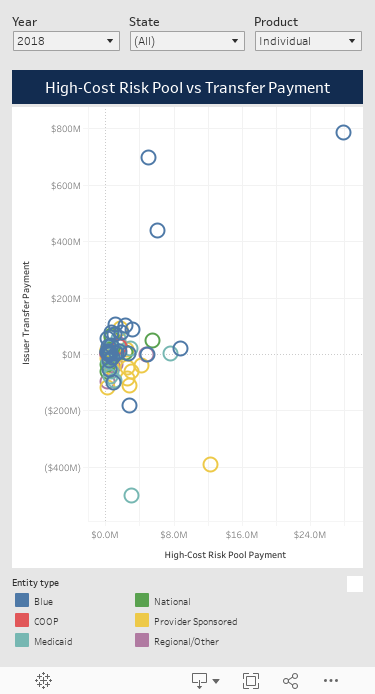
High-Cost Risk Pools
In Benefit Year 2018, CMS introduced “High-Cost Risk Pools” (“HCRP”), a program that reimburses issuers $0.60 for every dollar spent exceeding $1M on an individual patient. Pareto analyzed the results of the HCRP payments and found minimal correlation between transfer payments and high-cost risk pool payments. This illustrates the one-off nature of HCRP payments. A plan may have one very costly member, but the risk of this member is not large enough to move the needle on transfer payments. 70% of Small Group and 51% of Individual plans did not receive a HCRP payment for 2018.
Market Exits
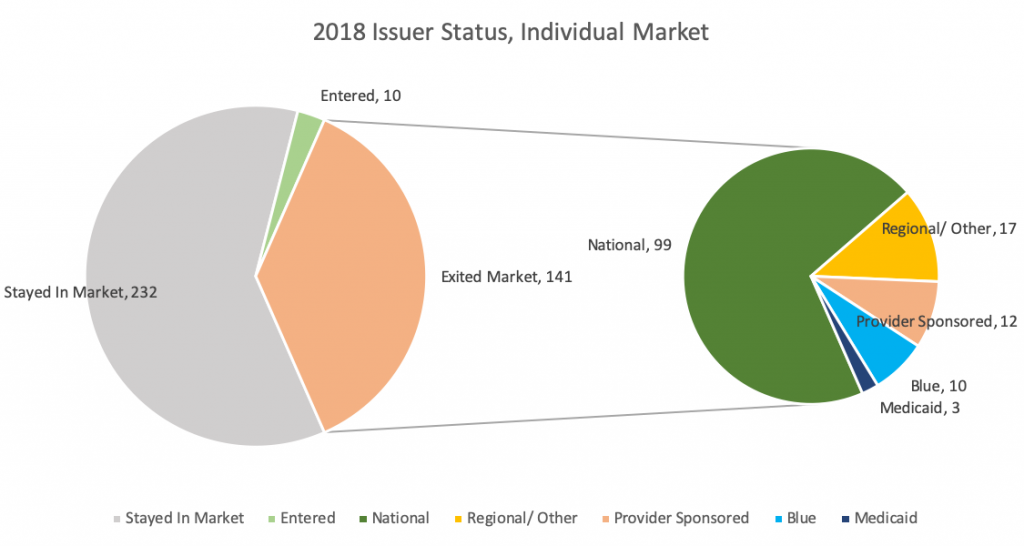
Individual: 141 issuers exited the Individual Market in 2018, an increase from 129 exits in 2017 and 105 in 2016. In general, we are seeing a large portion of National plans exiting across the U.S. Aetna, United, and Humana made up over 55% of the total Individual Market exits. As a result, five states are left with only one issuer for 2018 (and no transfer payments): Iowa, Nebraska, Delaware, Alaska, and Wyoming. Texas and Illinois led the way with a decrease of nine and seven issuers, respectively.
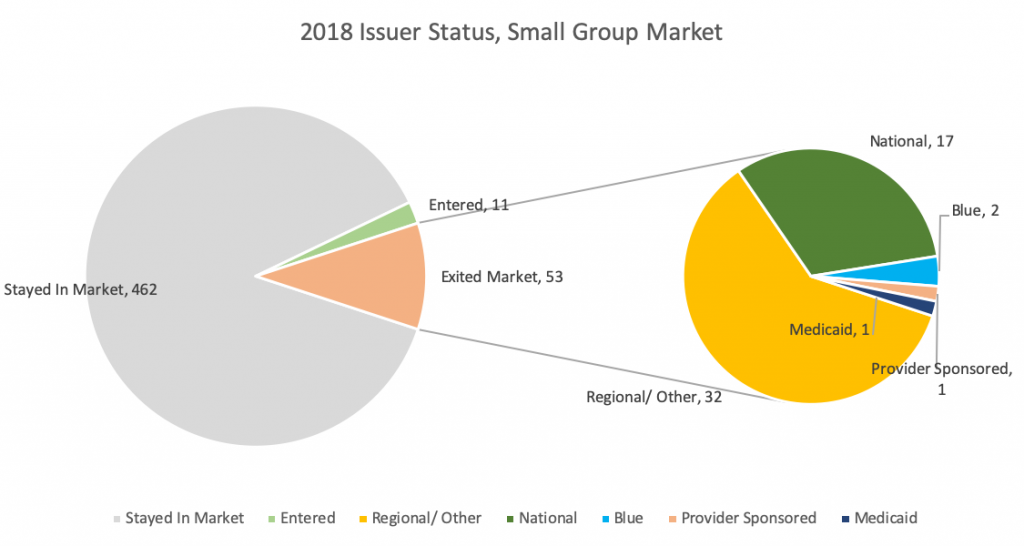
Small Group: 53 issuers exited the Small Group Market, the same number in 2017 and down from 116 in 2016. This further supports the idea of stabilization in the Small Group Market.
Issuer-Specific Insights
Top Receivers in 2018
| Blue Shield of California | $784,798,234 |
| Blue Cross and Blue Shield of Florida (16842) | $694,838,642 |
| Health Care Services Corporation – Texas | $435,834,956 |
| Blue Cross Blue Shield of Michigan | $105,190,785 |
| Health Care Service Corporation – Illinois | $102,754,253 |
Top Payers in 2018
| Centene Corporation – Florida | ($501,224,664) |
| Kaiser Permanente – California | ($392,457,699) |
| Molina Healthcare – Texas | ($264,718,028) |
| Blue Cross and Blue Shield of Florida (30252) | ($182,573,674) |
| Kaiser Permanente – Maryland | ($119,992,217) |
As National plans drop out of the market in 2018, a greater divide between the Blues and Regional/Provider-Owned Plans is occurring. The Blues transfer inflows are increasing at the expense of Regional/Provider-Owned Plans.
Kaiser
| Molina
|
Centene
| Cigna
|
State Profiles and Highlights
Utah
Individual Market
- Large increase in premiums (24.3%) led to enrollees buying down (2.3% drop in AV) and PLRS dropping by 1.3%
- This is 1 out of 3 states with a decrease in PLRS between 2017 and 2018
- SelectHealth saw a large positive transfer payment in 2017 (~13.5M) that changed to a large outflow in 2018 (~$48 M), potentially due to market exits in 2018 and a shift in enrollment
- University of Utah and Cambia Health Solutions saw large increases in receivables
Iowa
Individual Market
- Lost 6 Issuers leading
into 2018
- Aetna (~$11M in outflows) and Wellmark (~$10-$11M inflows) pulled out of market
- Largest jump in premiums in the country (+64%)
- Largest drop in member months (-35%)
- Highest rise in Allowable Rating Factor (“ARF”), indicating a shift toward an older population
Small Group Market
- Wellmark is a major player and remained in this market despite exiting the Individual Market
- 7% decrease in premiums
- Jump in enrollment while PLRS remained relatively flat
Nebraska
Individual Market
- Blue and Aetna dropped out of market
- 23.2% jump in premiums, 4.3% drop in member months
- Members buying down (0.5% drop in AV)
- PLRS remains flat
Small Group Market
- Blue and United are major players
- Large jump in PLRS in 2018
- Shrinking population means riskier and older members staying on
- Lower premiums, but members buying lower tier products
Illinois
Individual Market
- Dominated by HCSC – larger nationals pulled out of this market (Aetna, Humana, United)
- Slight increase in premiums compared to the rest of the country leading to a decline in enrollment
- Declining AV – members buying down with higher premiums
- Increase in PLRS is one of the highest in the country – appears that healthier members have dropped enrollment and sicker members have remained but bought down in metal level
Small Group Market
- Large number of
issuers, HCSC still dominates
- Aging population (one of the largest increases in ARF)
- Flat AV, riskier population
Percent Change in Premium vs. Current Year Premium
What Should Issuers Do?
It is critical for issuers to fully understand the makeup of their transfer payment. What were the primary and secondary drivers? Were there opportunities to change the outcome that should inform 2019 and 2020 strategies? Every issuer should be able to answer the following questions:
- How much of my transfer payment inflow/outflow was driven by the mix of members attracted? What is the competitive landscape of the market(s) I play in and have I positioned my products for success?
- How much of my transfer payment was impacted by risk that has gone undocumented? How am I going to close undocumented risk gaps in the remainder of 2019?
- Were there internal data quality issues from membership and encounter receipt through to submission and acceptance that impacted risk revenue (unreported risk)?
Knowing the answers to these questions for 2018 will allow issuers to focus on improvement opportunities that can have a material impact on 2019 results and beyond.